PIV on a Stereo Speaker
Particle Image Velocimetry (PIV) was applied to measure the flow pattern around a stereo speaker. A section of one of the images is shown, click on it to see a larger image (click your browsers "Stop" button to stop the animation). Since the nature of a speaker is vibration, the PIV system was externally triggered and phase-locked with the frequency of the sound emitted from the speaker (approximately 22 Hz). A function generator was interfaced with the speaker so that a trigger was sent to the PIV synchronizer at the same frequency as the emitted sound. The PIV system was then timed to capture PIV images "in-phase" with the speaker. In this way, multiple velocity fields could be captured at the same point in the vibration cycle of the speaker.
The flow was seeded with water droplets generated from an ultrasonic humidifier; the average size of the seed particles was on the order of 200 nm, which is probably too small for highly accurate velocity (ideally, each individual particle image should encompass at least 2-3 pixels). The size of the speaker was approximately 100 mm in diameter. The light sheet was directed in towards the speaker along the symmetric axis. A TSI 4 megapixel camera was used to capture the PIV images, and the images were analyzed with INSIGHT3G software, where a recursive nyquist scheme was used. The final interrogation spot size was 32 × 32 pixels.
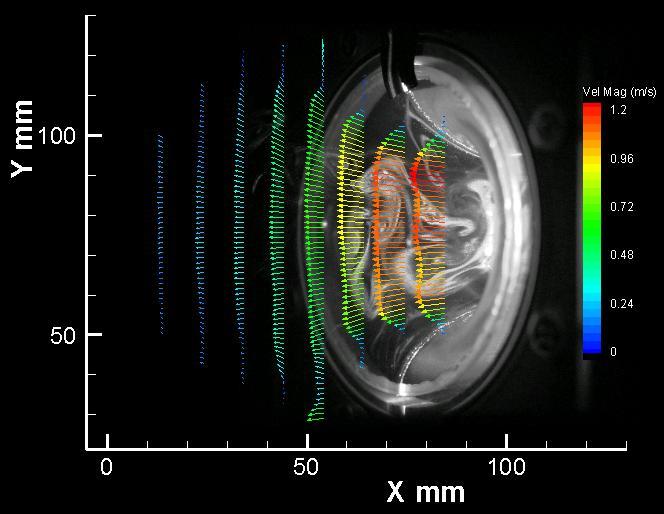
The plot shown here (click on it for a larger image) is phase-averaged over 20 vector fields, vectors are overlaid on one of the actual PIV images. Only every 8th vector is displayed in the x-direction. Interestingly, the maximum velocity of 1.2 m/s occurs at the top center of the axis of the speaker, rather than along the axis.