PIV on a Gurney Flap
A Gurney flap is a tab of small length (1% - 4% of an airfoil chord length) that is attached to an airfoil at the trailing edge on the pressure surface, at 90 degrees to the chord. It has been shown that the flap increases lift significantly, while increasing drag minimally for cases where the flap length is within the boundary layer region of the airfoil. Though this is known, the question remains, what exactly are the flow patterns in the region of the flap, and how are they producing this increase in lift?
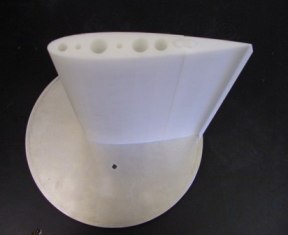
The image to the right is the flow model that was tested; it is a NACA0015 with a 4% Gurney flap. The rear section of the airfoil is interchangeable, so that a 1% and 2% flaps were also tested, along with a purely symmetric airfoil.
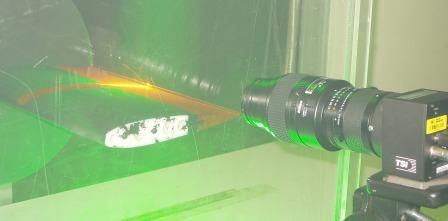
The image to the left was taken during a PIV capture. One of the biggest problems in PIV is overcoming the existence of strong reflections in your PIV images. If you are trying to get data very close to a surface, the reflected laser light can quickly saturate your camera (possibly damaging the sensor), so that no particles are visible in regions near the surface. One trick that was used to get vectors very close to the airfoil surface, was to paint the airfoil with rhodamine paint. Since rhodamine absorbs the green (532 nm) laser light, and emits light at a longer wavelength (around 560 nm), we were able to filter out the "reflections" off of the airfoil surface by placing a 532 nm band pass filter onto the camera lens.
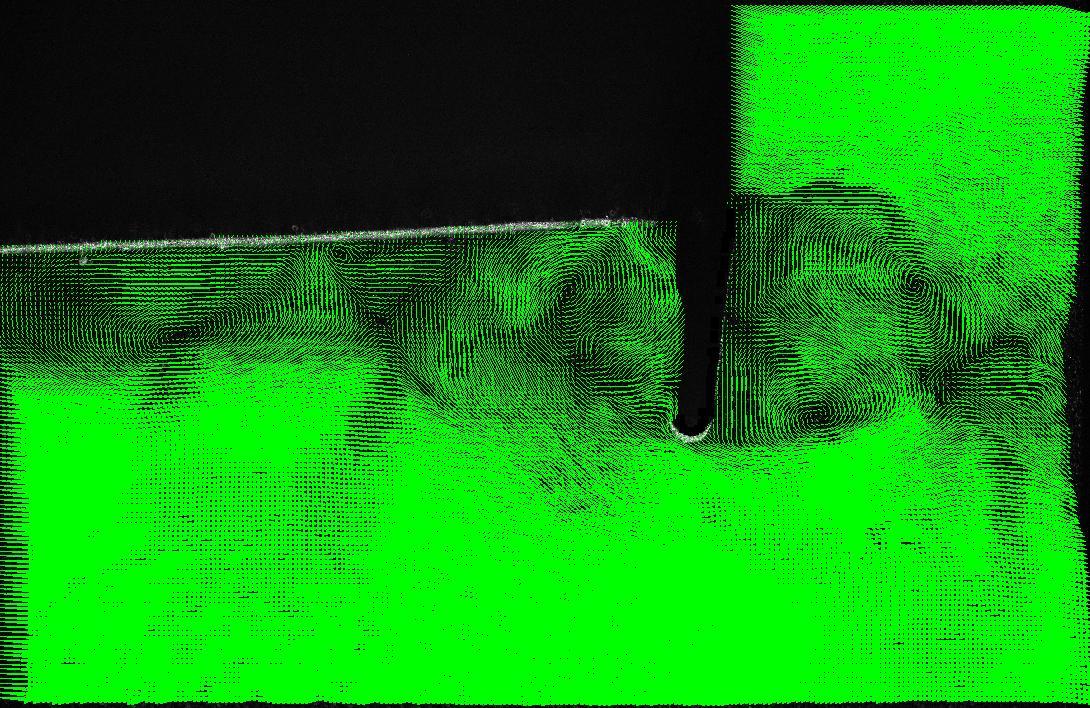
A typical high-resolution PIV image is seen to the right (spatial resolution of about 300 microns). Click on the image for a larger view. This image was taken at a Reynolds number based on chord length of about 1 × 10⁵. The flow is from left to right, and the airfoil is at an angle of attack of 8 degrees. The laser was directed into the windtunnel toward the flap. This is why there is a black region directly above the trailing edge, since no data was gathered there.
The first feature to note is that there is an asymmetric Karman vortex street downstream of the flap. Additionally, there are vortices upstream of the flap that will eventually be shed into the downstream wake. Of interest in these experiments, is the way in which the upstream and downstream shedding interact. For example, in this image, you can see a surge of downward velocity emerging from the upstream cavity, into the wake in the area of the flap tip. This is not always like this, in fact, the vectors just below the flap tip are usually quite horizontal. This upstream shedding is a periodic event (although it occurs in a less periodic way than the downstream shedding) that shows a greater degree of periodicity at higher angles of attack.
Time-Resolved PIV data was also taken on the Gurney flap in order to examine the upstream and downstream vortex shedding interactions. Image pairs were captured at 2000 Hz (4000 fps). It was found that the two shedding modes do not shed at the same frequency, and as such, they interact with eachother in the downstream wake in different ways. The upstream shedding produces a downward rush of fluid. If its exit happens to coincide with a similar downflow in the downstream shedding, then the two shedding modes interact constructively, creating one large surge of downward moving fluid. On the other hand, destructive interference occurs if the upstream shedding coincides with the opposite flow direction downstream, then the result is greater disorder downstream, and a less organized wake.
To see several animations illustrating these phenomena, click on the movie links below. These movies show the region of the Gurney flap tip. Red indicates upward velocity, blue indicates downward velocity.
Destructive Interference Movie (868k)Watch for the "surge" of negative velocity, where a patch of blue is seen at the base of the flap tip. When this shedding event occurs in the destructive case, you will see that this negative (blue) patch will interact destructively with a positive (red) region of velocity downstream. This creates a disorderly wake pattern with seemingly random patches of positive (red) and negative (blue) velocity.
Constructive Interference Movie (885k)The Constructive Interference clip shows a patch of negative (blue) velocity at the flap tip, emerge into the downstream wake while a similar region of negative (blue) velocity happens to be present. The 2 blue regions merge together constructively and continue downstream very smoothly.
For more information on this experiment, check out the Papers section of the website.