Z-Axis Window
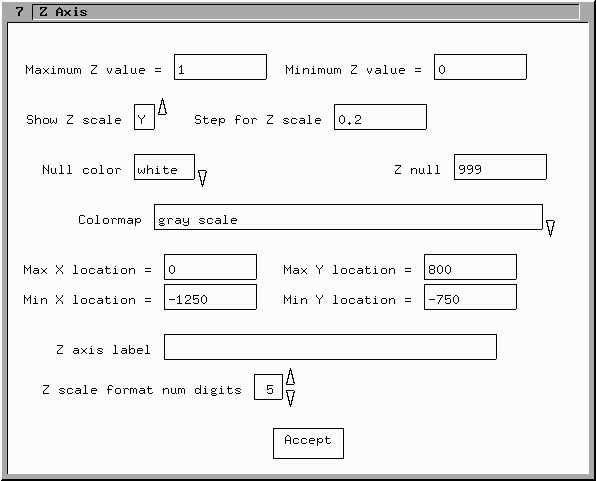
The Z-Axis window is show below in its
default condition for a CP file. See the Zaxis
window for image files only discussion for the cases of IMG, CMP or
SGI raster files.

The
Z-Axis window allows all of the settings associated with the raster data
and the display of the Z-Axis colorbar to be controlled. These settings
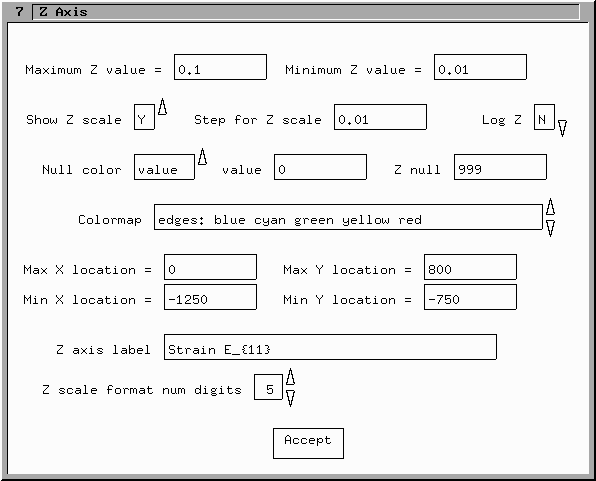
are discussed individually below. There are two other inputs that
become visible if other settings are changed, these are the null
value and Log Z inputs and they are shown below:

Settings
- Maximum and Minimum Z values
- These are the z data values that are mapped to the extremes of the
colormap, and they are used as limits for the colorbar to the right of
the body of the output plot.
- Show Z scale
- This settings determines whether the colorbar to the right of the
plot is displayed.
- Step for Z scale
- This setting controls the number of color squares displayed in the
colorbar.
- Log Z
- If the limits of the z scale are both greater than zero, it is
posible to use logarithmic scaling on the z data when it is colormapped.
- Null Color
- This sets the background color of the plot and the color used when
z values equal to the Z null value are encountered in the data
file. If set to value the null data points are replaced by this color
corresponding the the value entered into the value text box.
- value
- This value replaces any z value which have the z null data
value.
- Z Null
- This is the data value that is replaced by either the color white
or the color associated with the value discussed above.
- Colormap
- This list box allows selection of the colormap to be used for the
CP file data. An NTSC in front of a colormap name means that the
colormap only uses legal NTSC colors (restricted saturation, etc.).
The word edges refers the the edges of the RGB color cube. These
colormaps use only fully saturated colors.
- Max/Min X and Y locations
- For a CP file these text boxes are not editable and mearly display
the extents of the CP file data from the selected file.
- Z axis Label
- This is the text that is written along the vertical colorbar to the
right of the plot. It uses the same TeX like formating that is
available in GFx axis labels and comments.
- Z Scale Format Num Digits
- This setting allows the number of digits in the Z axis colorbar
labels to be selected.
- Preserve Aspect (not shown)
- See the raster file Z axis discussion.
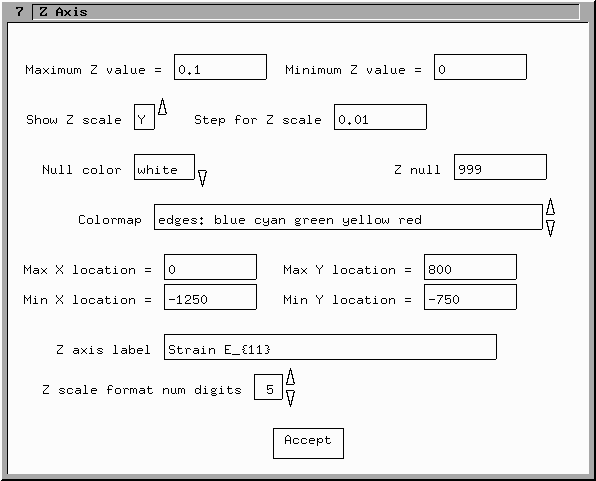
The image below shows the Z-Axis window with some different choices
selected and text box entries made. These settings were used to produce
the output image shown on the first page of
the PSALL manual.


