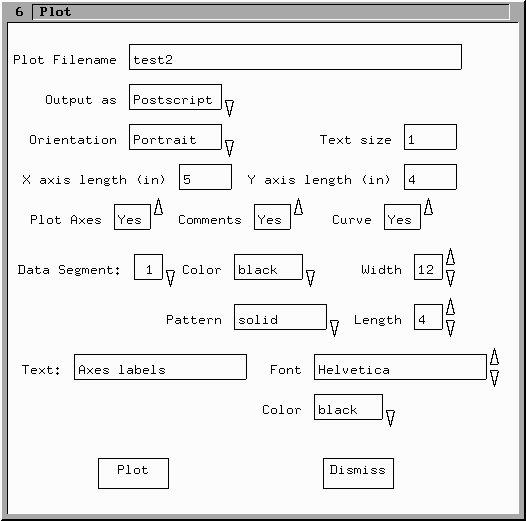
Clicking on the Plot button in the Menu window (or pressing the o key in the main window) brings up the following window:
This is the most complicated input window in GFx. The top input item is a list box for the Plot Filename. This name defaults to the name of the current file (without the ".gf" extension) if only a single file is loaded into GFx. The extension ".ps" for postscript output or ".eps" for encapsulated postscript will be appended if this name does not include an extension. The list box directly below the Filename text box, allows the choice between postscript and encapsulated postscript to be made. Below that the choice of portrait or landscape output is made.
To the right of the Orientation list box is a text box for the text size scaling to be used on the plot. The default for this value is 1.0 and this is a scale factor, thus 2.0 entered here makes the text twice as large as the default. The two text boxes below the orientation and text size boxes allow the size of the X and Y axes to be chosen. These inputs are in inches and give the size of the axes, the size of the overall plot including axes labels will be larger than the sizes specified.
The three list boxes, below the axes length text boxes, allow a choice of which elements of the plot will be rendered to postscript. Plot Axes includes the plot border, ticks or grids and the axes labels (max/min numbers and axes labels). The comments are the text placed on the plot using the Comment button in the Menu window. The curves are the data.
If the curves are selected to be plotted, then the next five input boxes (Data Segment, Color, Width, Pattern and Length) shown are visible. For each data segment (up to a limit of 100 segments) the output color, line width (in pixels), dashing pattern and dashing pattern length can be chosen. As the data segment list box is changed, the other four list boxes update to contain the choices for that data segment. The default values of these four choices are shown in the image above.
The final set of choices concern the Text that is placed on the plot. The list box labled Text determines which text the Font and color settings apply to. The first choice in the Text list box is always the Axes Labels. If any comments are defined then you can choose each comment in this list box as well (note that only the first 20 characters of each comment are shown in the list box). This set of three boxes works in a similar fashion to the Data Segment boxes described in the previous paragraph.