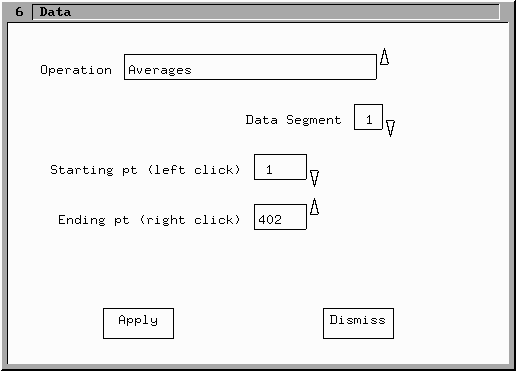
Clicking on the Data button in the Menu window (or pressing the t key in the main window) brings up the following window:

This window allows data transformation and manipulations to be performed as well as linear curve fiting and calculation of data averages. Some of these operations can be applied to all of the data or to just a single data segment. If the list box All Segments is changed to no, then the choice of data segment list box appears:
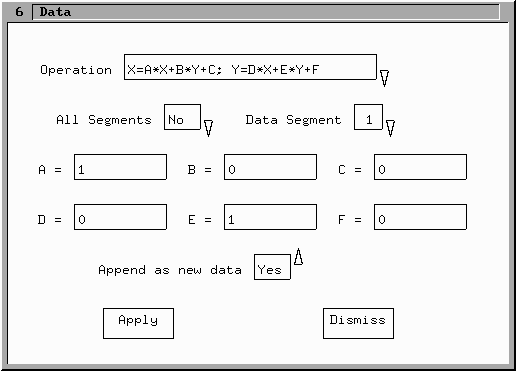
The first data transformation choice, as shown above, is a general linear transformation and the values as shown for A through F result in the identity transformation. The append as new data choice, causes the results of the transformation to be appended as a new data segment at the end of the current data. If it is set to no then the data is transformed in place.
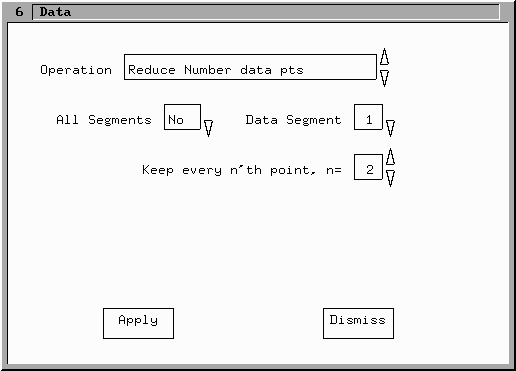
The second data transformation avaible by clicking on the down arrow of the Operation list box is Reduce Number data pts. This operation reduces the number of points in the data segment chosen (or all segments) by keeping only every n'th point. A choice of n=2 results in a reduction of the number of points by a factor of 2.
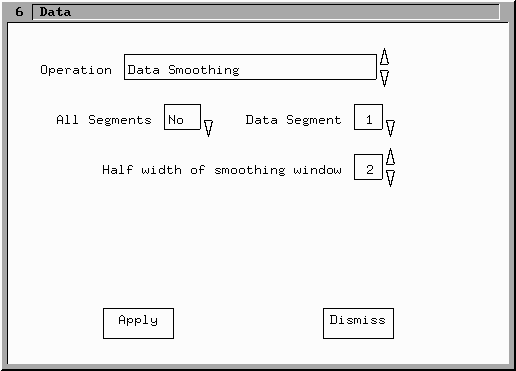
The third data transformation choice is Data Smoothing which uses a simple running average over a given number of points to smooth the data in a given (or all) segment(s). The number specified is the Half-width of the smothing window. Thus for a choice of 2 here, five data points are averaged (two on each side of the current point and the current point) to calculate the new value for the data point. This operation is done on both the X and Y data values.
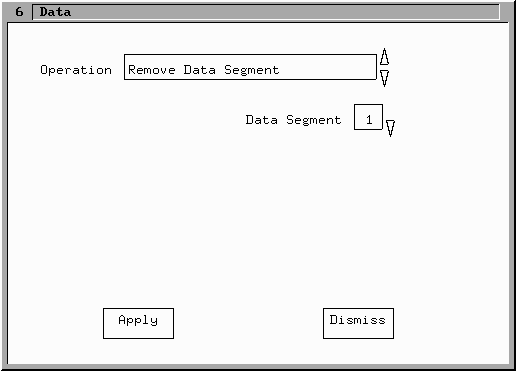
The fourth choice is to Remove a Data Segment. The data segment chosen is completely deleted from the data. Note that there is no Undo function, a reload from a data file is needed to recover the removed data segment.
The fifth operation is a linear curve fit. After chosing the data segment of interest, The starting and ending points in the data are selected. Note that these numbers include all of the data in storage and are not the relative position in the selected data segment. The points in the data segment can be selected using a mouse click. A click of the left mouse button in the Main window near the desired point on the selected data segment picks the starting point. Similarly a click of the right mouse button selects the ending point.
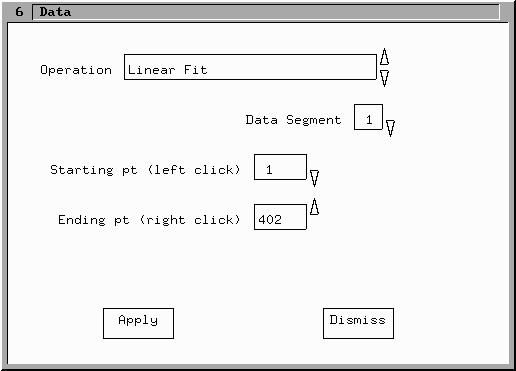
Once the desired points are selected, the Apply button performs the linear curve fit. The results of the fit are shown in a information window:

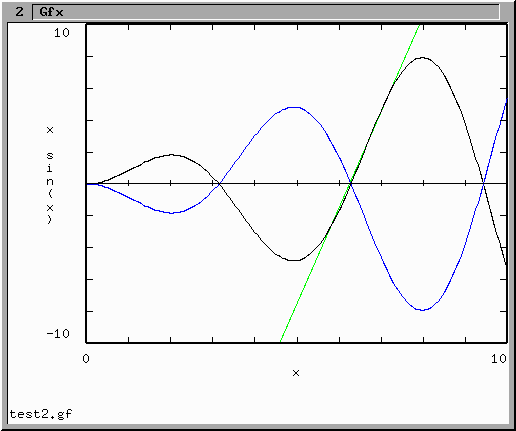
And at the same time the line cooresponding to this fit (green) is plotted on the main window:
Finally, you are prompted if you want to keep this curve as part of the data:
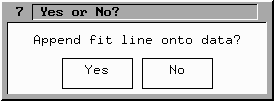
A yes button click results in the line shown being appended as a new data segment with two points to the end of the current data. Note that this line only extends between the current X maximum and minimum values.
The final Operation choice is Averages. In this operation, a part of a data segment is chosen in the same manner as for the linear fit shown above. Clicking the apply button performs the calculation of both the average X and average Y values of the data selected and presents the results in an information window in the same manner that the linear fit data is presented. This operation does not append any data.
